The argument over MoneyPuck's "boring and bad vs. fun and good" chart is the kind of thing hockey Twitter was built for, and most of it is a dodge. People are picking apart the axis labels and calling the whole thing a meaningless early-season sample. Others point to teams that look misplaced in their quadrants. Some of that is even right. The labels are clumsy, and one week into a season is a tiny, volatile sample. I wouldn't carve any of these placements into stone.
None of it saves the Flyers.
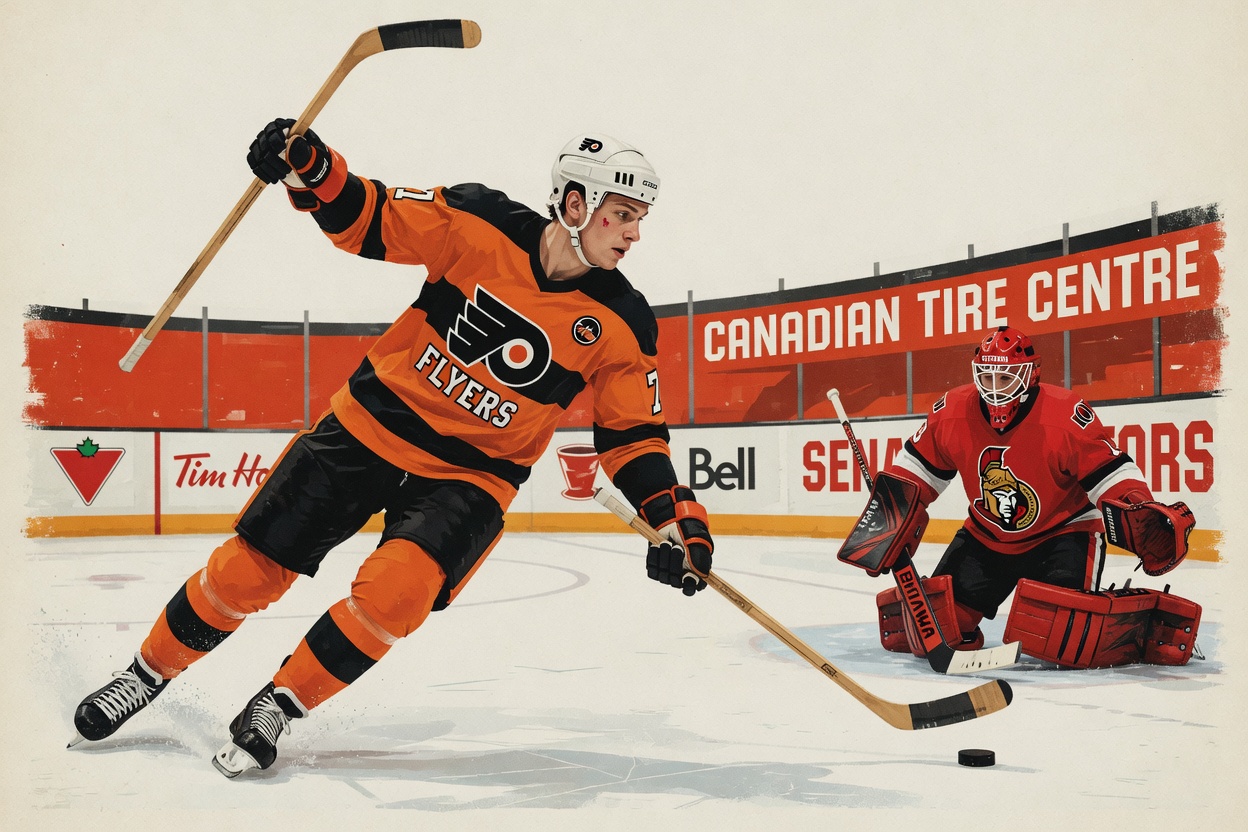
A cleaner graph wouldn't change the numbers underneath it. Through four games, Philadelphia's 5-on-5 expected goals share was 26.0 percent, last in the NHL. Their xGA/60 of 4.57 was last too, and their xGF/60 sat at 1.94. That's a team finishing bottom of the league at both ends. You don't need a quadrant chart to know where that lands. It lands exactly where the chart put it.
The raw shot counts are almost funny. Over those four games the Flyers were getting buried in attempts, losing the shot-attempt battle 121-246 and the high-danger battle 17-51. They were outshot 158-76, roughly double. Call the graph poorly designed all you want. A scoreboard that reads 158-76 isn't a design choice.
For the Flyers, the chart is just confirming the obvious. Any honest low-event/high-event scatterplot has to be built on numbers like these. It's drawing the story that's already on the ice.
Rick Tocchet is the one who put them there. His whole identity as a coach is built on limiting chances against. That's the pitch. Last season the system delivered: Philadelphia gave up some of the fewest scoring chances and expected goals in the league at 5-on-5 and led the NHL in blocked shots. The structure worked.
That's why this start is so alarming. In one recent game the Flyers allowed 40 shots to the defending Stanley Cup champion Hurricanes while managing 18 of their own. A defense-first team coughing up 40 shots to the best team in the sport means the whole philosophy is breaking down in the exact place it's supposed to be strongest. The system that made them fifth-stingiest in expected goals a year ago now has them dead last. Same coach, same identity, opposite result.
The best defense of Philadelphia is that it's four games, that xG swings wildly this early, and that a hot goalie or a couple of bounces flips the whole picture. Fine. Two points from four games means something kept them alive. Getting outshot two to one and surviving on luck is a confession.
The people mad at MoneyPuck are arguing the wrong case. The chart's labels could be gibberish and it would still be pointing at the right team. The Flyers are a defense-first team that forgot how to defend. They're playing hockey nobody wants to watch, and the man who sold them that identity has to explain why it's producing the worst numbers in the league.